|

Global Warming: reality or myth?
A survey of the Carbon Dioxide issue, and of the
damage that questionable science may be causing to genuine environmental causes.
|
|
Important Note: this
paper was written prior to the release of the Berkley Earth Surface
Temperature report (BEST) in October 2011. This is the current evidence:
BEST results indicate a
total variation in excess of natural variations due to
solar changes or other known effects. This gives much stronger support
to the IPCC case. My view is that the IPCC case is now much more
credible.
That does however still
leave room for much sceptical doubt, and in my view the issue is still 'under
review'.
|
|
Introduction
There are many
important environmental issues which deserve use of our global resources, such
as: habitat loss, extinction of species of flora and fauna, loss of
biodiversity, rainforest destruction, pollution, unchecked population growth,
adequate food production, waste, affordable energy ....
Within the last 20 years the
world economy and decisions on the use of global resources have become
strongly influenced by concerns about climate change.
The conventional
hypothesis advocated by the Intergovernmental Panel on Climate
Change (IPCC) is :
Manmade
carbon dioxide (CO2) emissions are causing significant and dangerous global
warming
On the basis of this hypothesis, Governments are
committing large sums of money to 'tackle climate change'. In the UK
alone, this amounts to £18 billion, 1% of Gross Domestic Product, per year,
for
the next 43 years.
But the concerns may be grossly
exaggerated.
The risk is that:
Misplaced concern with CO2 emissions
may cause other environmental issues to be neglected.
Misplaced concern with CO2 emissions
may hinder global economic development.
Misplaced concern with CO2 emissions
may result in pointless waste of global resources which could be better used
elsewhere.
These are the facts:
1 The world
has warmed over the last century, by 0.5 degree C above the historic
average.
2 This is
within the historic range of natural variation as measured over
the last 1100 years.
3 Computer
models which are used to predict carbon dioxide warming theory cannot
simulate the full range of historic natural variations. Therefore,
they are incomplete, or wrong. If they cannot simulate the past,
how can they correctly simulate the future?
4 The
natural variations can be plausibly explained by natural variations in
solar
heat, solar
activity and cloud cover. Current research is beginning to indicate
that these causes as much more likely to be influencing global climate than
CO2.
The purpose if this study is to examine the
credibility of the IPCC hypothesis.
|
|
|
Preface
A year ago I dutifully accepted the
'CO2 = dangerous global warming' theory as promoted by the IPCC.
I have changed my views as a result
of recent work by many scientists and other climate observers, my
own research, and direct questioning of 'IPCC' climate scientists on their own
forum.
If you want to share my
conclusions,
(which I have since discovered are shared with many scientists) all I ask is that you have an open mind, put aside any preconceptions and look objectively at the
evidence. If not, just stop here.
|
|
So pleased that you stayed on. Let's start.
Yes, the world has got warmer since
1850. Why?
The IPCC hypothesis is:
it's mainly due to increased CO2 in the atmosphere. and this is due to our
use of fossil fuels. The CO2 stops less heat escaping into space, and so
the earth warms up. This is called the greenhouse effect.
The IPPC then
makes worrying predictions of impending global disasters if we
do not mend our ways and stop burning fossil fuels.
 What
is the evidence for this? What
is the evidence for this?
The IPCC claim is based on
computer modelling. Computer models are
just large, complex calculation programmes, like the Excel spreadsheets
you yourself use. Like your Excel chart, when you want to justify
to yourself that you can afford a new car or holiday even after
paying the mortgage. they can be 'adjusted' - to produce almost any
result. If the result is not quite what is desired, it is so easy to go
back and tweak a figure or two... just a bit... and so tempting... and
so human.
One fact is clear:
There has never
been any field experiment in the Earth atmosphere to conclusively demonstrate and quantify a
direct causal link between CO2 content and warming.
The claim is based on: Laboratory
experiment, on
inference, on continual
adjustment of computer models to fit the
facts, and finally on
claimed correlation of the hypothesis with the
facts. (More on that later)
Why do I use the word hypothesis and
not theory? Because a theory must be capable of being falsified.
It must propose a clear link of cause and effect, which can be tested in
controlled conditions. The global warming hypothesis does not meet
these conditions.
The model structures are too complex
to analyse here. But
simple correlation is
an
excellent scientific first test of a hypothesis or theory. If the correlation is
poor, the hypothesis or theory is obviously incomplete, or wrong.
So let's consider the
correlation of CO2 levels with temperature over the last 2000 years:
|
|
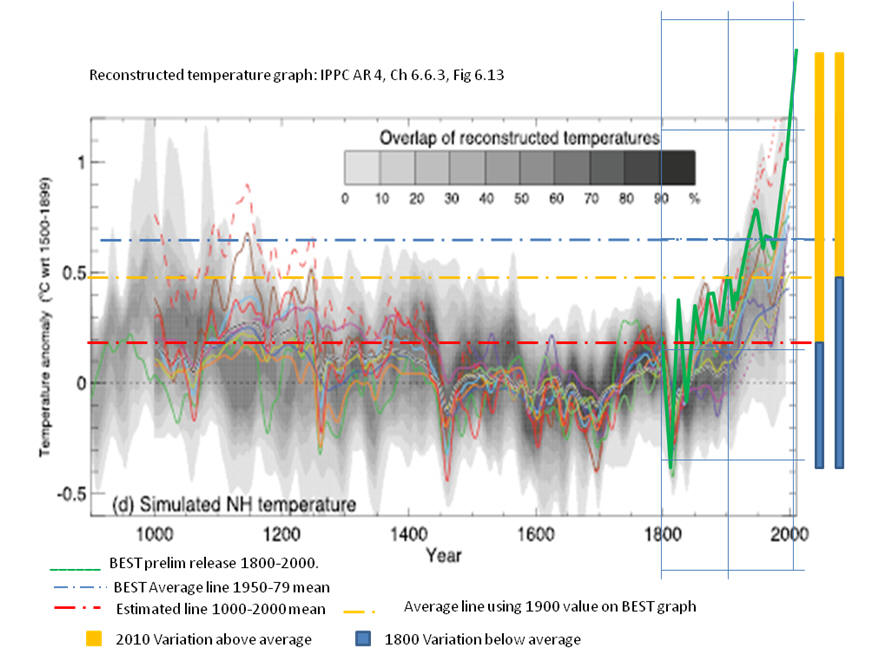
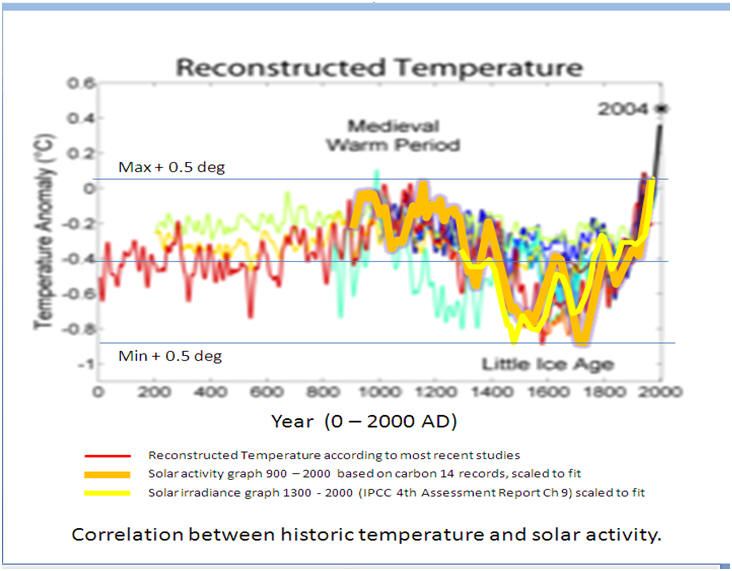
Reconstructions of Northern
Hemisphere temperatures
according to various older articles (bluish lines), newer articles
(reddish lines) and instrumental record (black line). Graph from
Wikipedia, checked as correct against other sources.
This graph is an
amalgam of several reconstructions of global temperature, all of which broadly agree, apart
from the extraordinarily steep black line in the period 1970 to 2000,
which comes from the IPCC and Goddard Institute (GISS) at NASA (more
about that later) .
Note the Medieval Warm Period ( Vineyards in North England, Viking settlements in Greenland,
a time of plenty in Europe), and the Little
Ice Age (Ice fairs on the Thames, advancing glaciers in Europe)
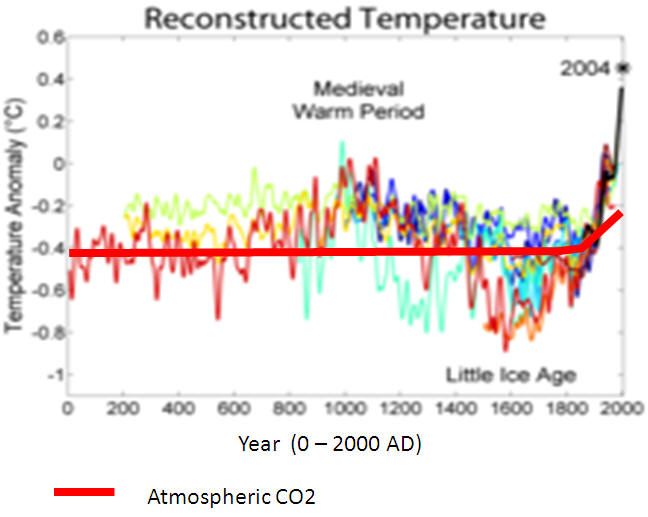
The red line is CO2 in the
atmosphere, generally agreed to have been stable at around 280 ppmv until
1800 AD, then rising to about 380 ppmv by year 2000.
ppmv (parts per miliion by volume) is the
conventional expression for CO2 content in the atmosphere. The present
level of 385 ppmv means that CO2 comprises 0.038% of the atmosphere.
Manmade CO2, 100 ppmv, comprises 0.010%, that is one part in ten
thousand, one molecule in 10,000.
|
|
What is the
correlation of CO2 content
with global temperature in the graph?
Zero from 0 to 1800 AD. Perhaps 5% over the last 2000
years.
- What caused the Medieval
Warm Period? An excess of CO2?
- What caused the 1 degree C fall into the Little Ice Age ? A shortage of CO2?
There is no evidence of any such
CO2 variation.
The
stability of the level of 280ppmv, prior to industrialisation, is in
fact the core of the IPCC case.
The IPCC accepts
that there are natural variations
in the earth climate, due mainly to variations in solar heat output and
volcanoes. These variations will happen regardless of
manmade CO2.
But the IPCC is not able to offer convincing explanations
or model simulations for the natural variations. The
IPCC models cannot explain the past. Yet it claims to be able to predict the future.
|
|
Model simulations
fail to give the right figures.
For example: Crowley T J, in Science, 14
July 2000, Causes of Climate Change over past 1000 years:
"Comparisons of
observations with simulations from an energy balance climate model
indicate that as much [sic] as 41 to 64% of preanthropogenic (pre-1850) decadal-scale temperature variations was due
to changes in solar irradiance and volcanism."
That
leaves 36 to 59% of variations pre 1850 unaccounted for by the
models.
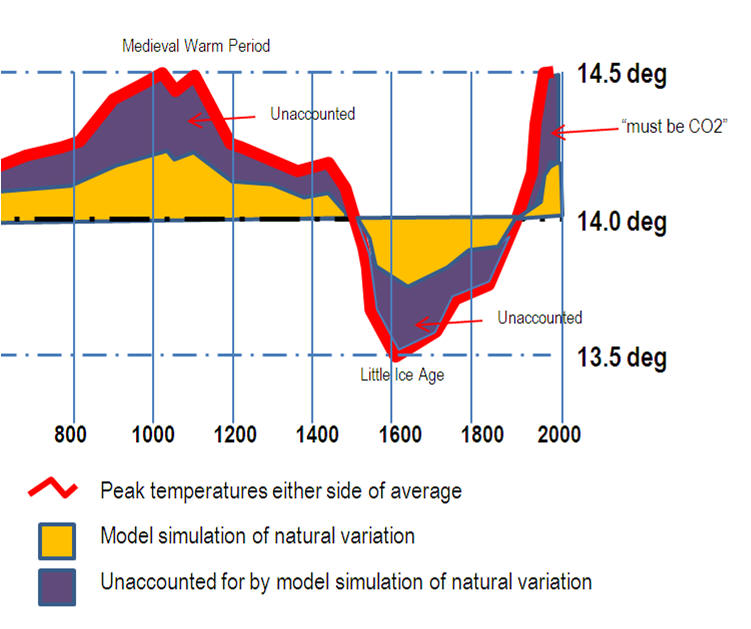
This shows
the gap between reality
and model simulation.
The yellow areas show
model simulation of temperature based on 41-64% as above.
The purple areas
pre 1850 are 'unaccounted for' by models.
CO2 levels were
constant up till 1850. There is no serious argument over that. So
the unaccounted gaps pre-1850 cannot be due to CO2.
Yet after 1850 - 1900 the gap 'must
be due to CO2 ' according to the IPCC.
|
|
The problem of the
pre-1850 gaps is just 'too difficult' for the modellers. So the problem
is ignored. Models cannot simulate the 0.5 deg rise since 1900 using assumed natural causes.
The model makers cannot think of any other plausible natural
causes. So the gap 'must be CO2' :
|
|
IPCC 4th Assessment Report 2007:
"No climate model using natural forcings alone has reproduced the
observed global warming trend in the second half of the 20th century. Therefore,
modelling
studies suggest that late 20th century warming is
much more likely to be anthropogenic than natural in origin,
a finding which is confirmed by studies relying on
formal detection and attribution methods
(Section 9.4.1.4)".
Note the
words: 'is much more likely'. Not ' we are certain',
or '95% probable'
. But 'much more likely'.
Conclusion of 'Formal detection and Attribution methods Section'
9.4.1.4: "Based on these detection results, which allow for
possible amplification of the solar influence by processes not
represented in climate models, we conclude that it is
very likely that
greenhouse gases caused more global warming over
the last 50 years than changes in solar irradiance."
Note the
words: 'it is very likely'. Not ' we are certain', or '95% probable' . But 'very likely'.
These are the words upon which world governments are forming policy. In
the UK, the Climate Change Act 2008 commits the government to spend
£18.3 bn per year over the next 43 years to 'tackle climate change. That
is 1% of GDP, £600 a year tax burden for 43 years
for every employed person in the UK. And of course it will cost more in
the end. it always does. The US government is committing itself to spend
$1.7 trillion, $1400 per person per year. Worldwide, the spend could be
$8 - 10 trillion dollars.
All based on "it is much more likely".
Report of an Ad Hoc Study Group on Carbon Dioxide and
Climate, Woods Hole, Massachusetts July 23.–27, 1979 to the
Climate Research Board , Assembly of Mathematical and Physical
Sciences, National Research Council:
“We conclude that the predictions of CO2-induced climate changes made with the
various models examined are basically consistent and mutually supporting. The
differences in model results are relatively small and may be accounted for by
differences in model characteristics and simplifying assumptions. Of course, we can never be sure that some badly estimated or totally
overlooked effect may not vitiate our conclusions. We can only say that we have
not been able to find such effects.”
At least this statement is
refreshingly honest. So, if something has been badly estimated or overlooked? 10
trillion dollars down the drain. Sorry!
 And if we were to do nothing? We will all burn in a fiery
Hell. For our sins. So we are told. But perhaps "it ain't necessarily
so"? And if we were to do nothing? We will all burn in a fiery
Hell. For our sins. So we are told. But perhaps "it ain't necessarily
so"?
Fortunately other scientists, many coming from
fields other than mainstream climate science, have been looking into the
problem for several years, and explanations are beginning to emerge.
|
|
What
else could have caused the natural variations?
|
Earth heat?
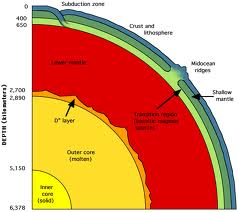 Basic
physics says that heat passes from a hot body to a cold space. The core
of the earth is at 7000 degC. The
earth itself emits heat into the air and oceans, and eventually into space. Underwater
volcanoes emit heat and CO2 into the deep oceans. Nuclear reactions in the earth's core,
shifts in the mantle, and heat emission into the deep oceans may be as variable as sunspots.
For example, we know for certain that 55 million years ago, a major shift in the
mantle and release of heat underwater warmed the deep oceans by 5 - 7 deg C. The resulting warming of the Earth by 4 - 5 deg C caused major extinction
of species. Basic
physics says that heat passes from a hot body to a cold space. The core
of the earth is at 7000 degC. The
earth itself emits heat into the air and oceans, and eventually into space. Underwater
volcanoes emit heat and CO2 into the deep oceans. Nuclear reactions in the earth's core,
shifts in the mantle, and heat emission into the deep oceans may be as variable as sunspots.
For example, we know for certain that 55 million years ago, a major shift in the
mantle and release of heat underwater warmed the deep oceans by 5 - 7 deg C. The resulting warming of the Earth by 4 - 5 deg C caused major extinction
of species.
|
|
The Sun?
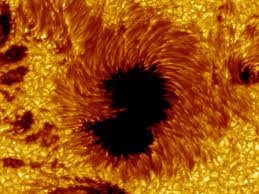 Sunspots
are temporary phenomena on the Sun that appear as dark spots
compared to surrounding regions. They are caused by intense
magnetic activity, forming areas of reduced surface
temperature. Sunspots and their
cyclical occurrence are well known and recorded. Sunspots
are temporary phenomena on the Sun that appear as dark spots
compared to surrounding regions. They are caused by intense
magnetic activity, forming areas of reduced surface
temperature. Sunspots and their
cyclical occurrence are well known and recorded.
Some interesting facts about
sunspots:
"Sunspots were rarely observed
during the
Maunder Minimum in the second part of the 17th century
(approximately from 1645 to 1715). This coincides with the
middle (and coldest) part of a period of cooling known as the
Little Ice Age."
"In 2006, NASA
made a prediction for the next sunspot maximum, being between
150 and 200 around the year 2011 (30-50% stronger than cycle
23), followed by a weak maximum at around 2022. The prediction
did not come true. Instead, the sunspot cycle in 2010 was still
at its minimum, where it should have been near its maximum."
During periods of low sunspot
activity, the earth receives a higher incidence of cosmic rays.
A CERN experiment has indicated that in periods of low sunspot activity, cloud
formation is increased due to an increase in cosmic rays.
Increased cloud cover means a cooler Earth.
More about that later.
|
| Let's consider
any possible correlation with Solar activity |
|
This is the Solar Activity over 1100 years 850
- 1950 AD, based on carbon14 record. It corresponds with sunspot activity. |
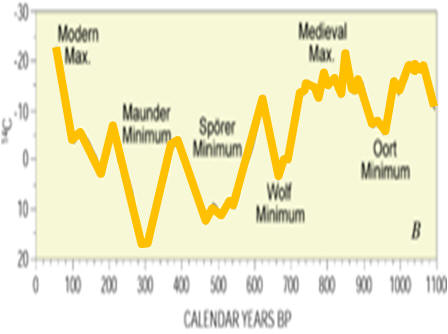
Graph from
Wikipedia.
Note that as with many carbon14 graphs the timeline is 'Before Present'.
and runs from 1950 AD at left, to 850 AD at right.
It runs opposite the usual direction, R-L.
|
| So it has to be reversed L-R for comparison
with the temperature graph: |

The same graph now runs L-R from 850 to 1950
AD |
| Now transpose it onto the world temperature
graph 850 - 1950 AD: |
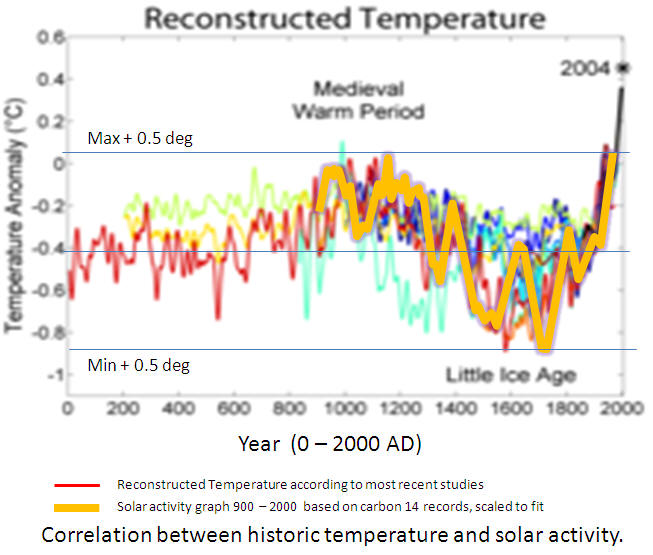
The
correlation
with solar activity is remarkable.
Take a good look at this graph.
Note the historic variation: 0.5 deg C
each side of the average, 14 deg C.
Up till 2000 warming is within the range
of natural variation.
(Reminder : ignore the contentious black line)
This makes the decade following 2000 of great interest…
Is warming continuing beyond 2000?
SInce 1998
the trend of global surface temperature has not continued
its earlier rise.
Apart from 'El Nino' peaks, the graph is statistically flat.
|
| Over the last 100 years Solar activity has doubled. |
| What
is the conclusion so far? |
|
The only recorded significant temperature
correlation with CO2 levels in the last
2000 years is from 1850 to 2000, a change from 280 ppmv to 380ppmv. Earlier
levels of CO2 are generally accepted as being constant at around 280ppmv from 0 -
1850 AD.
There is
no evidence to demonstrate that earlier climate variations
in prehistory were
induced by variations in CO2. There are many obvious and
accepted reasons why CO2 levels follow climate change. Just one example: Warmer oceans
release more CO2 into the air.
The IPCC case is based
on an apparent broad correlation (and a correlation still very variable in the
short term details) of the hypothesis with historical data over a period of just
150 years, and with more precise satellite data over 20 years.
This is a very short period indeed upon which to claim evidential proof
of long term climate changes.
The models cannot account for the pre-1850
historic natural variations of +/- 0.5 deg C. The models are wrong or incomplete. If they cannot explain the
past, how can they claim to predict the future?
Increased CO2 in the
atmosphere does have a greenhouse effect, along with the major greenhouse gas, water vapour (which
is responsible
for between 90% and 95% of the greenhouse effect - estimates vary)
and
many other gases and
chemicals. But the magnitude of the effect may be seriously over estimated by GISS/NASA and the IPCC.
|
|
The basic IPCC calculation:
The IPCC estimates
that out of a 0.8 degree global warming since around 1850:
-
Natural change (solar
irradiation and volcanism) has caused about 0.2 deg,
-
Manmade CO2
has caused about 0.6 deg.
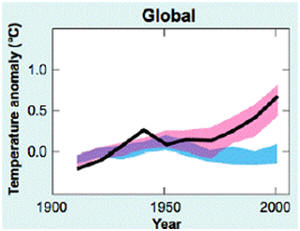
This figure compiled from
the IPCC report Summary for Policy Makers (Feb 2007).(Fig SPM-4) and viewable at
www.appinsys.com/GlobalWarming
shows the IPCC argument graphically.
The black line shows
average temperatures.
The
blue
band shows the
results of simulations from climate models using only the estimates of
natural forcings due to solar activity and volcanoes.
The
pink band, matching
the temperature lines show the results of simulations from climate models
using both natural and CO2 forcings.
This is supposed to
demonstrate two things:
1 The models are correct
2 The
difference between the blue band and the pink band ‘must be due to manmade CO2’.
There is
no direct proof for this estimate of CO2 warming. The
model predictions are very sensitive to certain input parameters, which can be easily
varied to produce different results.
The solar estimate is
claimed by many researchers to be wrong, because it is based only on variation of the
heat emitted by the sun - solar irradiance. It does not consider
changes in solar activity - more of that in a moment.
If the effect
of the Sun has been under-estimated, the effect of CO2 will have been
over-estimated.
|
|
It may be questioned whether it is even
correct to refer to a 'warming of 0.8 deg since 1850'. Look at the record.
Temperature in the Little Ice Age 1600 - 1800 was 0.5 deg below the historic average.
It returned to the historic average
during the period 1850 - 1900.
It has since increased to a level which is
0.5 deg above the average. So by 2000 there has been only
a warming of 0.5 deg C relative to the historic average.
That is within the historic range of
natural variation.
|
|
So
- how exactly can the Sun affect
climate?
|
|
The heat emitted by
the Sun, solar irradiance, does not vary much over sunspot cycles,
about 0.1%, not enough to cause
significant warming on earth. For many years this was the main objection to a theory of sun-induced climate
change. It looked like the 'smoking gun', but without any bullets. It puzzled me for a while after I had come across the obvious
correlation, and written the first draft of this paper. Then, I was referred
to ground-breaking work by Danish researcher Henrik Svensmark and British researcher Jasper
Kirkby, amongst others. For that reason, I now include their findings here.
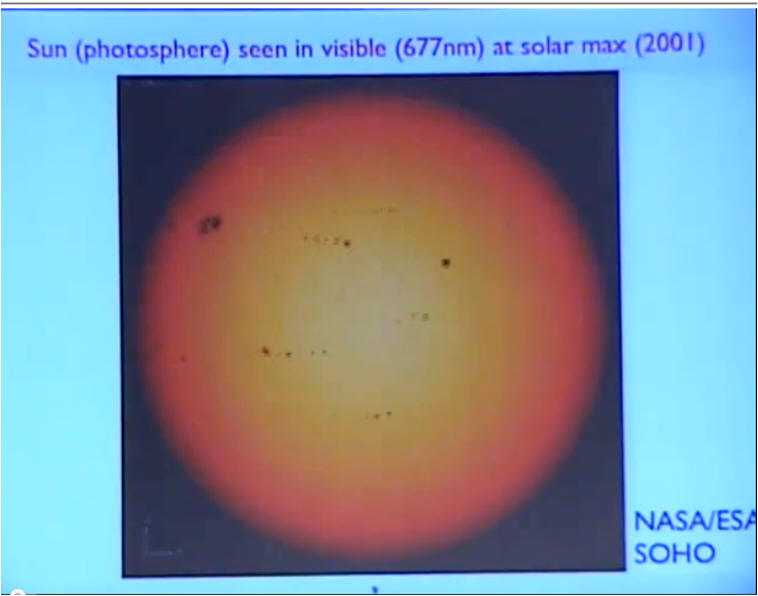
This is the reality: The Sun has an invisible face.
The left picture below shows Sunspots viewed in the visible
spectrum, apparently quite insignificant.
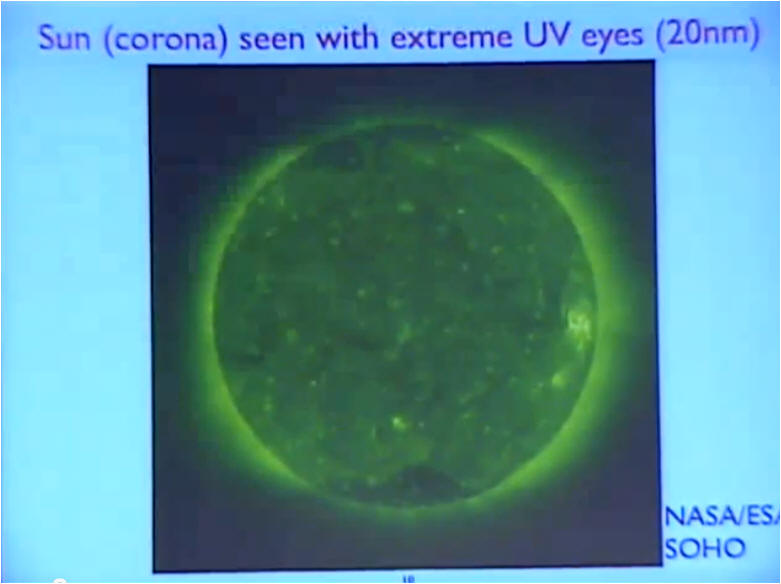
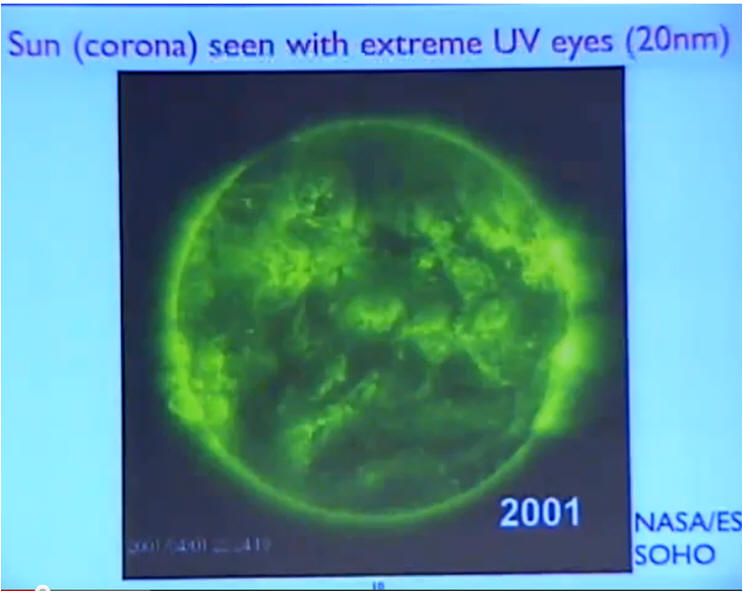
But viewed in the
ultra violet spectrum the difference between a calm Sun with
few sunspots (centre picture) and an active Sun at the peak of a sunspot cycle
( right picture) is quite awesome. The intense flares and the rotating sun create a vast,
rotating solar wind
of magnetically charged particles
which sweeps across the solar system and far beyond. This is
solar activity. |
   |
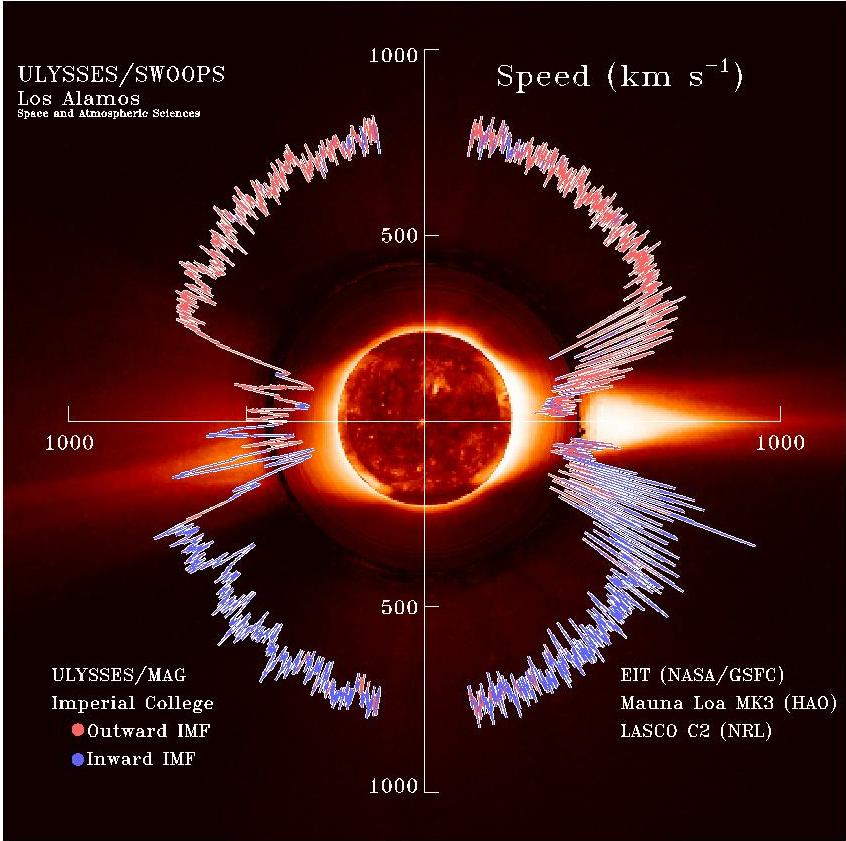 This
picture from NASA illustrates the solar wind. radiating outwards from the
Sun. The sun rotates every 25 days. The effect is like a rotating
fan, creating a vast, slowly rotating magnetic field. The intensity of the
field varies in line with sunspot activity. This
picture from NASA illustrates the solar wind. radiating outwards from the
Sun. The sun rotates every 25 days. The effect is like a rotating
fan, creating a vast, slowly rotating magnetic field. The intensity of the
field varies in line with sunspot activity.
Like a
protective mother, the Sun's solar wind helps to shield the Earth from incoming
galactic cosmic rays - particles emitted by countless exploding stars over
billions of years. But just
like a tired mother, the Sun sometimes take a break - as shown by the graph of
solar activity. When the Sun rests, the solar wind drops.
|
|
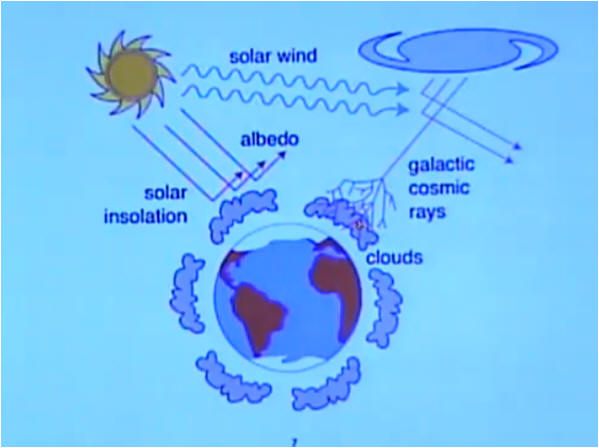
How can the solar wind affect the climate on earth?
Incoming galactic cosmic rays 'seed' clouds in the
atmosphere. A very significant
CERN experiment
first proposed in 1996, and finally conducted in August 2011 has now proven in experimental conditions that cloud
nucleation is increased by an increase in cosmic rays.**
Sunspots create high magnetic activity and
solar wind. The solar wind deflects incoming galactic cosmic rays. Less
cloud nucleation = less low
level clouds. The earth warms up.
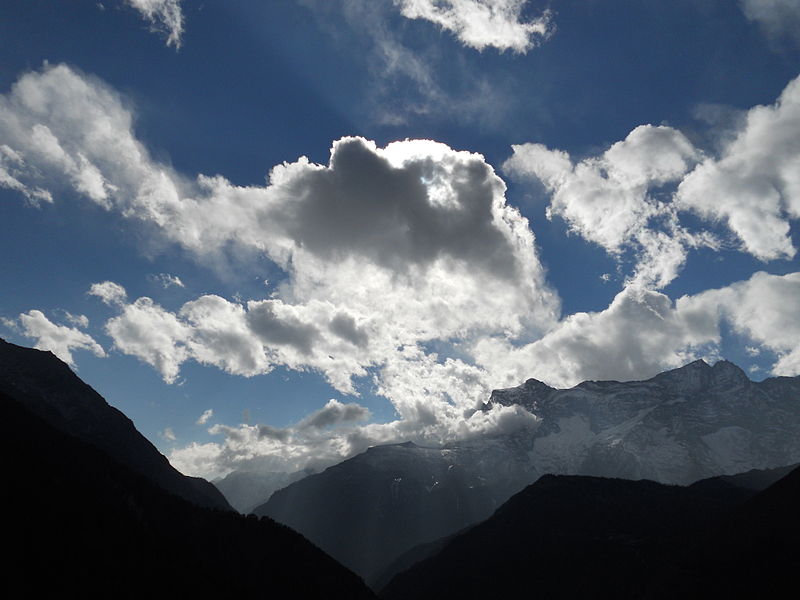
High solar activity means less clouds,
bluer skies, and a
hotter Earth.
Low solar activity means more clouds,
greyer skies, and a cooler
Earth.
(Diagram from 2011 Lecture by Jasper Kirkby)
* * See
Appendix 1 CLOUD Experiment.
In addition to this, the solar system moves around
within the galaxy, and the strength of incoming cosmic rays varies over galactic
time, in cycles and events which can be precisely calculated. Henrik Svensmark,
Nir Shaviv
and other
researchers have shown that the Earth climate record correlates with cosmic
ray variation not just over the last 1100 years, but over the last 3 billion
years.
The Sun's influence extends
throughout the solar system. In effect. Earth and the other planets exist
within the Sun's atmosphere. If it changes, we change.
The solar system itself is
part of the galactic system. The Earth's climate is hardly more than a
thermometer of events and causes must vaster than our own activities.
|
|
The relative size of the main components
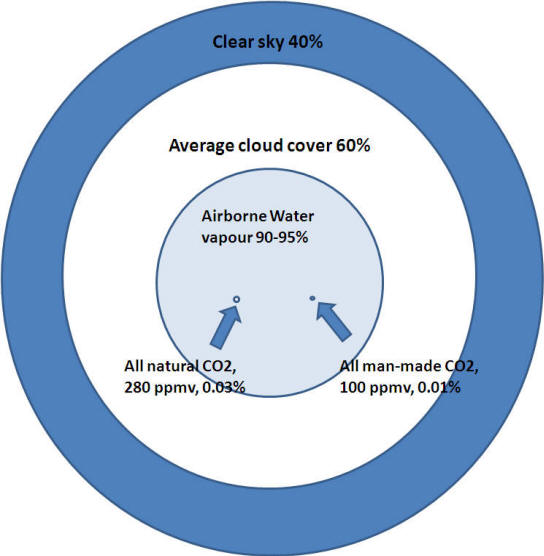 THE
SKY DOME THE
SKY DOME
Average clear sky is 40%.
Average cloud cover is 60%.
Greenhouse gases:
Water Vapour 90-95%
Natural CO2: 0.03%
Manmade CO2: 0.01%
Cloud cover can change surface
temperatures by more than 10 deg C in the course of 24 hours
The cooling effect of Clouds is hardly considered in IPCC
models.
Time for a reflective pause? |
 |
|
Returning to the graph of temperature and solar activity: |
|
There is now at least one plausible explanation
for the correlation between climate change and solar activity. The Sun causes climate
change. Not so much by direct heat, but by varying the solar wind,
modifying the extent of cloud cover. IPCC models assume little or no variation
in cloud cover, as if the clouds were just passive elements in the
equation.
Simple personal observation will confirm
that cloud cover can change surface air
temperatures by more than 10 deg C in the course of 24 hours;
I have measured this at the equinoxes which are the median points in the
annual cycle. I have measured it in London, and while driving 1000 km
through France on several occasions, observing temperature drops of 4-5
deg C in just 20 miles, due to low clouds.
The
missing gap in the IPCC models is about 0.25 deg C.
A simple calculation will show that variation of
average cloud cover of just 2.5% would account for that
discrepancy in full.
|
|
 We
can check that figure of 2.5% another way. This IPCC diagram shows the
Earth's energy balance. Energy of 342 Watts per sq m comes in from
the Sun. 77 W/sm is reflected by Clouds, Aerosols and Atmospheric
Gases. Let's make a rough guess that Clouds reflect 70 W/sm.
The IPCC estimates the additional energy radiated back to the Earth by
CO2 warming to be 1.7 W/sm. In order to add 1.7 W/sm of
energy to the system, another simple calculation will show that cloud cover would need to be reduced by
2.5%. That coincides with the figure derived from
temperature above. We
can check that figure of 2.5% another way. This IPCC diagram shows the
Earth's energy balance. Energy of 342 Watts per sq m comes in from
the Sun. 77 W/sm is reflected by Clouds, Aerosols and Atmospheric
Gases. Let's make a rough guess that Clouds reflect 70 W/sm.
The IPCC estimates the additional energy radiated back to the Earth by
CO2 warming to be 1.7 W/sm. In order to add 1.7 W/sm of
energy to the system, another simple calculation will show that cloud cover would need to be reduced by
2.5%. That coincides with the figure derived from
temperature above.
(Please don't take these figures as any more than my
empirical guesswork; I don't have access to a supercomputer and £1m
worth of funding.) |

This
diagram shows the cloud variation needed to produce the
full range of climate
variation recorded over the last 1100 years, up to 2000 AD. The clouds
are drawn to scale. Can you tell the difference?
The relative extent of cloud cover has never been
recorded until very recently, when satellite measurements began.
There is a serious shortage of data upon which
to check for a correlation between cloud cover and temperature.
A good technical study of the cloud issue is
here.*
*Global Warming as a Natural Response to
Cloud Changes Associated with the Pacific Decadal
Oscillation , Dr R Spencer, 2008
|
|
There is little historic data on relative extent of
cloud cover. But there are very detailed records of hours of sunshine
in many parts of the world. The record of hours of sunshine is an
excellent indicator of relative
cloud cover.
More sunshine hours = less cloud.
This
figure shows the temperature data plus two of the sunshine data lines for 1960
to 2004.
The two comparison curves are for “SE & Central S
Eng” and “E & NE England”.
Hours of sunshine per day have steadily
increased since 1970.
Therefore
cloud cover in England at least has steadily decreased since 1970.
1970 is the point from which CO2 warming
is claimed to have taken off.
IPCC Climate models
'don't do clouds'. (Ian Plimer)
Most of the temperature curves show an almost exact
correspondence with hours of sunshine.
graph from
www.appinsys.com/GlobalWarming
Has something been missed?
|
Let's return to the "Reality Gap" chart: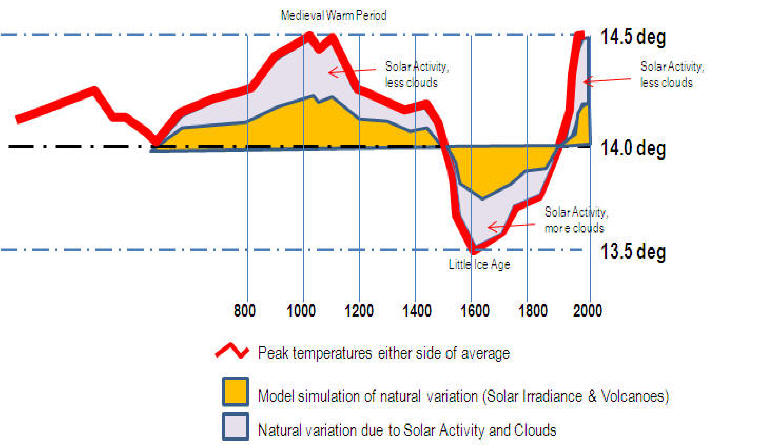
If we look again at the missing gaps and attribute them
to varying solar activity and cloud cover, in total accordance with
the records for solar activity, the Medieval Warm Period and the
Little Ice Age variations can be fully explained.
It can also explain 20th
century warming, in full. Simply by adding in a variation in average cloud cover
of 2.5%.
Cloud variation can explain earlier
history; why not modern history?
J R Norris: Observed Interdecadal
Changes in Cloudiness: Real or Spurious?
Advances in Global Change Research, 2007, Volume 33, II:
"Upper-level cloud
cover has decreased over almost all land regions since 1971 and has
decreased over most ocean regions since 1952."
|
|
A final check on correlation
in the
20th
Century |
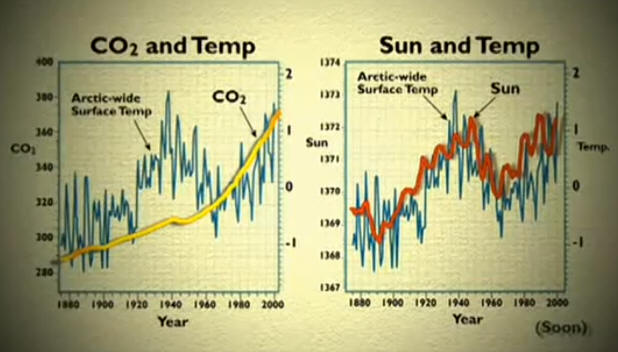
From 1900 to 1940 global industry was developing slowly. Few people
owned cars. CO2 emissions rose slowly. But
temperature rose sharply almost 1 deg C.
From 1940 to 1975 there was a postwar boom. Industry expanded
rapidly. Cars and consumer goods were mass produced. CO2 emissions
accelerated. But temperatures
consistently fell over 35 years. Climate
scientists in the 1970's even began to warn of a 'new Ice Age'.
A broad correlation 1850 to 2000, but total failure in the
details as shown in the left hand graph.
And the correlation between temperature and
solar activity in the right hand graph?
You can form your own
opinion.
|
|
Here are other examples of the correlation with solar activity.
1 - Simple solar irradiance
Here we add in
a traced copy of the IPCC’s own 2007 graph of solar irradiance from 1300 to
2000, the thinner
yellow line.
The IPCC
models rate solar irradiance as only a minor contribution to climate change.
But the
correlation looks pretty good.
|
|
2 Sunspot cycle length
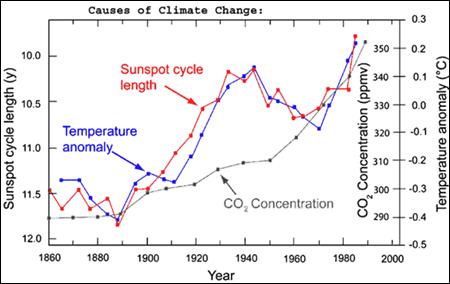
From
Global Warming Science:
Although the sunspot cycle is approximately 11 years it
varies and has generally been getting shorter over the last century.
The figure shows Variations
in the air temperature over land in the Northern Hemisphere (solid line)
closely fit changes in the
length of the sunspot cycle (dashed line).
"Shorter sunspot cycles are associated with
increased temperatures and more intense solar activity. This suggests that solar
activity is at least partly responsible for the rise in global temperatures over
the last century”
(Professor Kenneth R. Lang, Tufts University [http://ase.tufts.edu/cosmos/view_picture.asp?id=116])
The correlation with sunspot cycle length is far better
than with CO2 levels .
|
|
|
|
Comment:
Public acceptance
of the CO2 theory has been helped, by two historic facts: Firstly by the 1973 oil crisis when the
idea of fossil fuel conservation was first promoted as a moral obligation - for
example, speed limits of 55 mph were imposed in the US and rigorously enforced.
To waste fuel became an anti-social activity. Secondly, by the
acknowledged success and the sound science of the CFC/ozone layer observations
of the 1980's.
But the argument for fuel conservation to reduce reliance
on foreign oil is different from that for control of CO2 emission; and CFC's and CO2 are not the same thing.
By all means argue for reduction of excessive
waste, excessive consumption, and reliance on fossil fuels. But don't confuse
those arguments with an argument for reduction of CO2 emissions. That
theory is based on
very poor evidence and poor science.
|
|
A good theory
should be derived from accepted and tested physics. All
factors must be considered. A theory is only acceptable once all other
possible factors which may be influencing the data have been eliminated.
Current climate science is a long way from that target - ask any climate
scientist.
No matter how complex the computer models
are, no matter how much money is poured into refining them, if the models are
incomplete, the results are questionable.
|
|
The possibility of error has indeed been considered by climate scientists: |
|
1 Understanding and Attributing
Climate Change. In:
Climate Change 2007: The Physical Science Basis. Contribution of Working Group I
to the Fourth Assessment Report of the Intergovernmental Panel on Climate Change
"Remaining uncertainties.
Further improvements in models and analysis techniques have led to increased
confidence in the understanding of the influence of external forcing on climate
science the Third Assessment Report.
However, estimates of some
radiative forcings remain uncertain, including aerosol forcing and inter-decadal
variations in solar forcing"
"Significant uncertainties, in particular,
are associated with the representation of clouds, and in the resulting
cloud responses to climate change. "
"Cloud
feedbacks remain the largest source of uncertainty
in climate sensitivity
estimates."
2 From Report of an Ad Hoc Study Group on Carbon Dioxide and
Climate, Woods Hole, Massachusetts July 23.–27, 1979 to the Climate Research
Board , Assembly of Mathematical and Physical Sciences, National Research
Council
“We conclude that the predictions of CO2-induced climate changes made with the
various models examined are basically consistent and mutually supporting. The
differences in model results are relatively small and may be accounted for by
differences in model characteristics and simplifying assumptions.
Of course, we can never be sure that some badly estimated or totally overlooked
effect may not vitiate our conclusions. We can only say that we have not been
able to find such effects.”
Look harder? |
|
Might there
be other 'overlooked effects?
What about the biosphere?
Ongoing research is looking into the role of organic
material in the atmosphere and its effect on cloud creation. Microbes can
seed clouds just like any other airborne particles. The
atmosphere should be considered as part of the biosphere. Once that is
accepted the power of biological evolution comes into the picture. As
the Earth warms up due to natural variation, biological processes could be helping to seed and create more clouds, which then cool the Earth
- who knows? Perhaps James Lovelock's Gaia concept of a self-regulating Earth is not
so far-fetched? 500 million years of evolution is a long enough time for a
lot of surprises to be in store.
 'Airborne
bacteria make it rain, researchers find'.
Feb 2008 'Airborne
bacteria make it rain, researchers find'.
Feb 2008
" The
sky is not an ethereal, sterile realm. It's teeming with bacteria, and
scientists say that the microbes play a powerful role in producing rain and
snow. While the idea that bacteria could prompt precipitation was previously
known, a paper published this week in
Science shows that they're
more important than anyone expected.
In its latest
report, the International Panel on Climate Change said that the
impact of feedback loops involving clouds on global weather patterns
are the
"largest source of uncertainty"
in current predictions of climate' change."
'Aerial microbes can make it
rain'
May 2011
"These data add to a growing body of evidence that
biological organisms are affecting clouds,
notes Anthony Prenni of Colorado State University in Fort Collins. Right
now, he cautions, “We still don’t know on a global scale how important these
processes are.” But research into microbial impacts on weather and climate is
really heating up, he adds, so “within a few years, I think we’re going to have
a much better handle on it.”
Interesting times? |
|
Some final comments on climate models |
|
1 Components:
These are the
main components in a climate model designed to simulate a manmade CO2
warming effect
- a
measured value of the CO2 molecule
re-radiation effect in laboratory conditions. (proven)
- a
modelled extrapolation of this value using greenhouse gas theory to produce an estimate of the
increased energy in the lower atmosphere measured in Watts per square
metre (unproven in the field).
- an
modelled estimate of the rise in
temperature caused by the increased energy (unproven in the
field)
- an
'amplification factor' (estimated and variable) which can
treble the laboratory effect.
- a
'climate sensitivity factor' based on observed reaction of
climate to volcanic dust, but not to CO2 (estimated and
variable)
- A final Model
estimate of the Net Warming effect in
degrees. (estimated)
- an
assumption that CO2 levels are increasing solely due to
manmade emissions (unproven).
Simply expressed:
Measured Value x Modelled extrapolation x Modelled Estimate x
Amplification factor x Climate sensitivity factor x Model assumptions = Net
warming in deg C
Clearly there are many
opportunities in this long equation to adjust the factors. Amplification Factor alone can vary from x1 to x3.
Having invented
and built your
model (and perhaps fallen in love with it, as inventors often do) and of
course having secured ample funding for your project
for a good few years:
- You run the
model and it produces a
forecast (which cannot be checked experimentally)
- If you don't
like the forecast because it doesn't correlate with facts, you can
adjust any of the factors until you get something
you do like. Few people understand your model well enough to
question your adjustments. If they do, you can tell them they just
'don't understand'.
- You ignore
the fact that not one of the IPCC models can produce simulations
which correlate with historical records.
Is this good
science?
|
|
2 Amplification
Models build in an 'Amplification' factor. This is an
assumption that a relatively small warming effect of CO2 itself is magnified
by
increasing water vapour levels in the air.
From 'Skeptical
Science', a website supporting the CO2 theory run by climatologist John Cook:
"
How
does this work? The amount of water vapor in the atmosphere exists in direct
relation to the temperature. If you increase the temperature, more water
evaporates and becomes vapor, and vice versa. So when something else causes a
temperature increase (such as extra CO2 from fossil fuels), more water
evaporates. Then, since water vapor is a greenhouse gas, this additional water
vapor causes the temperature to go up even further—a positive feedback.
How much
does water vapor amplify CO2 warming? Studies show that water vapor feedback
roughly doubles the amount of warming caused by CO2. So if there is a 1°C change
caused by CO2, the water vapor will cause the temperature to go up another 1°C.
When other feedback loops are included, the total
warming from a potential 1°C change caused by CO2 is, in reality, as much as
3°C "

[Hang on, water vapour -
isn't that the stuff that makes haze and clouds? Which can cool the climate?
Well .... yes...]
Consider
carefully the statement: "If you
increase the temperature, more water evaporates and becomes vapor".
The
correct physics is; warmer air has the capacity to
hold more water vapour. That is all that is certain.
This basic fact has been turned into the proposition that CO2 causes far more warming that can be
shown by laboratory experiment.
The
amplification proposition is:
We will assume by
inference from modelling that CO2 increases temperature by X degrees.
Warmer air can hold more water vapour. Water vapour is a greenhouse gas. We
will ignore
cloud formation. Therefore we will assume that the modelled rise of X degrees
produces water vapour which we will assume causes Y degrees more warming,
and that this entitles us to create an amplification factor and say the
CO2 effect is 2X or even 3X degrees.
There
is no suggestion of any direct mechanism from CO2 to water vapour.
(Because no such mechanism exists).
There is
a false assumption that warming automatically produces more water vapour (a totally
unsupported
proposition)
The amplification factor is not a measurable physical constant.
It is a
product of theoretical computer modelling .
Assumption laid upon assumption... It can be very convenient when 'adjusting'
the full climate models to 'persuade' them fit the facts. Just tweak the
assumed amplification until you get the desired result.
But "amplification feedback" is
theoretical, and unproven.
|
|
To summarise:
|
|
The vast majority of historic climate change
can be plausibly explained as driven by solar activity and cloud cover
variation. The correlation
with facts is many times better than with CO2. A manmade CO2
effect is plausible in principle, but its magnitude is not clear. Even IPCC models make widely
varying forecasts, which have changed over the years. The
evidence for significant CO2 warming simply is not
good enough.
No
matter how complex the computer models are, no matter how much money is poured
into refining them, if the model is incomplete, if 'something has been missed', the output is questionable.
All
the dire warnings are credible, IF you accept the basic IPCC premises. Which
are:
1.
CO2 molecules resonate at certain wavelengths in the infra red
spectrum, and reradiate that energy to cause local warming in the surrounding
air. Evidence: laboratory experiment. Proven.
2.
That causes a warming at the level of the lower atmosphere.
Evidence: inference from theoretical models, and observation. Warming of
lower atmosphere happens: Observed . Cause of warming:
Unproven.
3.
An Amplification factor is acceptable in models to multiply
the assumed warming effect. Evidence: an inference.
Unproven and variable.
4.
A Climate Sensitivity factor is acceptable in models to
further multiply the assumed effect. Evidence; direct observation of the
cooling effect of volcanic dust. No evidence based on direct observation of
a warming effect of CO2. Unproven and variable.
And you ignore the objections:
-
Variation to year 2000 of +0.50 deg C above historic average
of 14 deg C. is within historical range of +/- 0.50 deg C as estimated
over last 1100 years. No increase since 2000.
-
IPCC Models attempting to simulate those known natural
variations can only account for about 50% of the variation, +/- 0.25 deg
C . The other 50% is unexplained.,
-
No field experiments have ever been carried out which can
conclusively test the
theoretical models' assumption of the basic warming effect and demonstrate
a direct causal link between CO2 levels and warming. Hard to believe,
but true.
-
Cloud formation is poorly understood and hardly considered. (IPCC
own statements). Cloud cover has a cooling effect on surface temperature of
more than 10 deg C. A variation of just 2.5% in average cloud cover
would account for a temperature variation of 0.25 deg C and fully explain
natural variation without the need for 'CO2 warming' at all.
Cloud cover has hardly been measured or recorded in detail.
-
Solar activity effect on cloud cover is not modelled at all.
-
The August 2011 CERN CLOUD experiment has finally confirmed
the predicted causal link between solar activity and cloud
nucleation.
IPCC
models attribute the 0.8 deg C warming since 1850 as about 0.2 deg due to the
sun, 0.6 deg due to CO2. This ‘proves’ that their models are correct. They
then go on to extrapolate the 0.6 deg C ‘due to CO2’ warming to produce their
predictions of warming, between 2 and 6 deg C over the next 100 years.
But:
If the effect of the Sun is under-estimated, the effect of CO2
will be over-estimated.
If the effect of CO2 is
over-estimated, all model simulation predictions are over-estimates. The over-estimation may be
considerable.
Research into solar activity is ongoing. Natural solar activity is likely
to be by
far the major cause of global warming and cooling.
Other factors such as the role of micro-organisms may have a further
effect, and may even provide a self regulating mechanism which has perhaps kept
the Earth climate relatively stable for the last 500 million years.
Variation up to 2000 AD is within the historic range of natural variability.
Since 1998, CO2 levels have continued to increase, but
global surface temperature has
not measurably changed. It is at a plateau. This may indicate the end of a solar
warming period and the beginning of a solar cooling period.
|
|
What about the future?
If the climate is mainly driven by variations in
solar activity, where is the climate heading?
David Archibald predicts that we are
now entering a long-term solar activity downturn. Looking at the graph, we
seem to be at about the same place as we were in year 1100 AD. It is not
global warming, but global cooling that is ahead.
On the other hand, the Earth may
continue to warm naturally, and CO2 levels may rise to 450 ppmv. That will
mean perhaps: 30% increase in food productivity. Less demand for heating and
fossil fuels. A moderate rise in sea level, which can be planned for.
Increased rainfall in many regions. (Warmer air does not mean less rain,
it is just as likely to mean more rain.) Increased vegetation growth
worldwide. Possible greening of the edges of the Sahara. The list is long.
More people die from cold than from heat.
Unfortunately, solar cycles
are not yet very predictable. Nobody really knows for sure what will happen over
the next 10, 20 or 100 years. All that is certain is that the climate will be at the
mercy of the Sun. And if David Archibald
is right, we might even need all the warming we can get. |
|
A final comment on the Carbon Dioxide issue, and the
damage that questionable science may be causing to genuine environmental causes
As Murry Salby points out: CO2 content in air =
All production less All
sinks. Primary CO2 sinks are the oceans and plant life.
 "Natural" CO2 is produced in vast quantities by
warming of the oceans and soil bacteria, and by submarine ocean vents - nearly 900 gigatons of natural Co2, against 29 gigatons of manmade CO2
annually (IPCC figures) Most of that is re-absorbed by growing plant life
in the earth and the oceans, and by the ocean surface waters. "Natural" CO2 is produced in vast quantities by
warming of the oceans and soil bacteria, and by submarine ocean vents - nearly 900 gigatons of natural Co2, against 29 gigatons of manmade CO2
annually (IPCC figures) Most of that is re-absorbed by growing plant life
in the earth and the oceans, and by the ocean surface waters.
The total
CO2 held in the atmosphere is about 3,000 gigatons. CO2 stored in deep
oceans is estimated as 150,000 gigatons. Much more is held in rocks and soil.
Significant CO2 variations in
prehistory can be shown to be
entirely a result of natural global temperature change or natural
geological events.
500 million years ago in the
Cambrian period the CO2 content was 6,000 ppmv. One way or another, the Earth atmosphere has survived for
millions of years, without our help, perhaps through self regulation involving a
symbiosis between the Earth and the biosphere.
CO2 is not a "pollutant". It is part of
the natural world. All animals exhale CO2. Plant life needs at least 200ppmv of CO2. Commercial greenhouses operate at 1000ppmv.
Humans can safely live in levels up to 5000ppmv.
Carbon dioxide is an
invisible and odourless gas, it is
not "carbon", it is not "smoke". It is the bubbles in
fizzy drinks, it is what makes bread rise. It is part of life.
You do not have a "carbon footprint" at
all.
Carbon dioxide is not "dirty polluting soot", any more than the
salt - sodium chloride - in the oceans "pollutes" the sea with combustible sodium and
poisonous chlorine.
The case for global warming due to manmade CO2 is
based on very questionable evidence. Yet a large portion of global resources is
being invested to deal with the 'catastrophic damage' predicted by the IPCC.
There are many
important environmental issues which deserve use of our global resources: habitat
loss, extinction of species of flora and fauna, loss of biodiversity, rainforest
destruction, pollution, unchecked population growth, adequate food production,
affordable energy ....
Obsession with CO2 emissions should not be
allowed to cause those issues to be neglected.
Obsession with CO2 emissions should not be
allowed to destroy global economic growth.
Misplaced concern with CO2 emissions
may result in pointless waste of global resources which could be better used
elsewhere.
The development of non-fossil fuel based
energy (alternative energy) has many benefits other than reduction of CO2
emission, such as sustainability and autonomy. Such development should be encouraged; but the arguments and
criteria for their development should not be confused with
CO2
emission arguments.
The Earth's climate is not your fault.
We are not going to burn in a fiery hell for our sins. Nor will our
children. So we should stop telling them these untruths. Thanks for listening. |
|
Richard Bird, October 2011. |
|
|
Appendix 1.
The
CLOUD Experiment at CERN: Cloud formation as
a result of cosmic rays.
From CERN official
press release 25 August 2011:
"CERN’s
CLOUD experiment provides unprecedented insight into cloud
formation. The CLOUD results show that a
few kilometres up in the atmosphere sulphuric acid and water vapour
can rapidly form clusters, and that cosmic rays enhance the
formation rate by up to ten-fold or
more. "
The graph shows how cosmic rays help promote
the formation of clusters of molecules that can then grow and seed clouds in the
real atmosphere.

Source: Fig. S2c
from supplementary online material for J. Kirkby et al., Nature, 476, 429-433, ©
Nature 2011
At 03.45 am in a
CLOUD experiment in Geneva, ultraviolet light began to create molecules in the
cloud chamber, which approximates the air in the atmosphere. Jn above shows the
neutral phase of the experiment, during which the CLOUD experiment electrically
removed ions and molecular clusters. At 4.33 am, the CLOUD experiment stopped
the electrical removal and allowed natural galactic cosmic rays (Jgcr) to enter
the chamber through the roof of the Geneva building, leading to a faster rate of
cluster buildup.
Then, at 4.58 am,
CLOUD also beamed charged pion particles (Jch) from an accelerator (these are
equivalent to cosmic rays), the rate of cluster production took off,
convincingly demonstrating the effect of cosmic rays on cluster growth.
More on this.
Main Nature article
Nature article
Cloud
formation 1 Sep 2011 |
|
|
|
Appendix 2: Where is the climate
heading?
 If
we accept that NASA sometimes gets it right, this prediction of the solar cycle
up to 2020 indicates that the trend is downwards. If
we accept that NASA sometimes gets it right, this prediction of the solar cycle
up to 2020 indicates that the trend is downwards.
Note the low point in 1995, the peak at 2000,
(when global temperature reached a maximum) the descent in
the first decade (in which global temperatures fell) and a small rise up to 2011. The prediction is another drop
towards 2020. Possibly a longer downward trend thereafter, well into the
21st century.
We could be heading towards a cooler Earth. If CO2 has a
significant warming effect, we may need it!
Unfortunately, NASA has been wrong on solar variation predictions before.
The truth is, in the present state of knowledge, nobody can accurately predict
solar activity. What that means for governments and
voters, is of course another story.
|
|
Appendix 3: Some 'major
difficulties'.
Below is the front page of
James Hansen et
al's seminal paper of August 1981 in which he postulates the CO2 = global
warming theory. Note the text outlined in red.
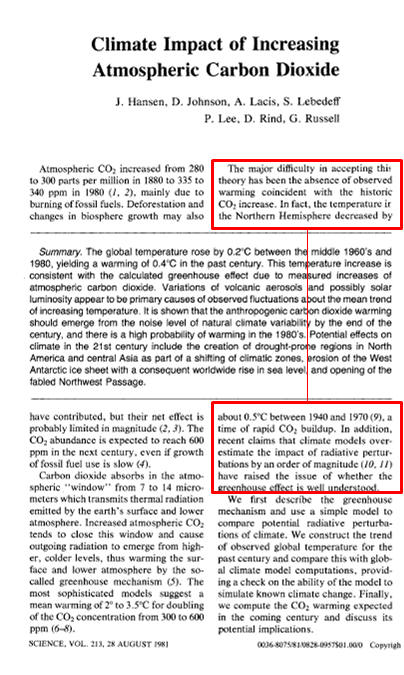
"The major difficulty in accepting the
theory has been the absence of observed warming coincident with the historic CO2
increase. In fact the temperature in the Northern Hemispheres decreased by about
0.5 degC between 1940 and 1970, a time of rapid CO2 buildup."
Indeed, a major difficulty. The facts didn't
fit the theory.
This statement, for obvious reasons, is not much publicised by IPCC. James Hansen
has been the Director of the
Goddard Institute at NASA (referred to at the
beginning of this page) since 1981, and is responsible for
the issue of the most important climate data upon which the IPCC bases its
modelling and forecasts. He is the main originator of the global warming
theory, which is his 'baby' and which made his name. As such he is in a highly influential position of extreme bias.
He is also highly vociferous and maintains a high public and political profile. Much of the data published by NASA/GISS is strongly contested by scientists,
and considered to be biased manipulation of the raw data.
The paper continues
"Recent claims that climate models
overestimate the impact..... by an order of magnitude have raised the issue of
whether the greenhouse effect is fully understood."
In other words, if the facts don't fit the
theory, it's because the theory is misunderstood. Is this good science?
For more on the theme of
data manipulation, see below.
|
|
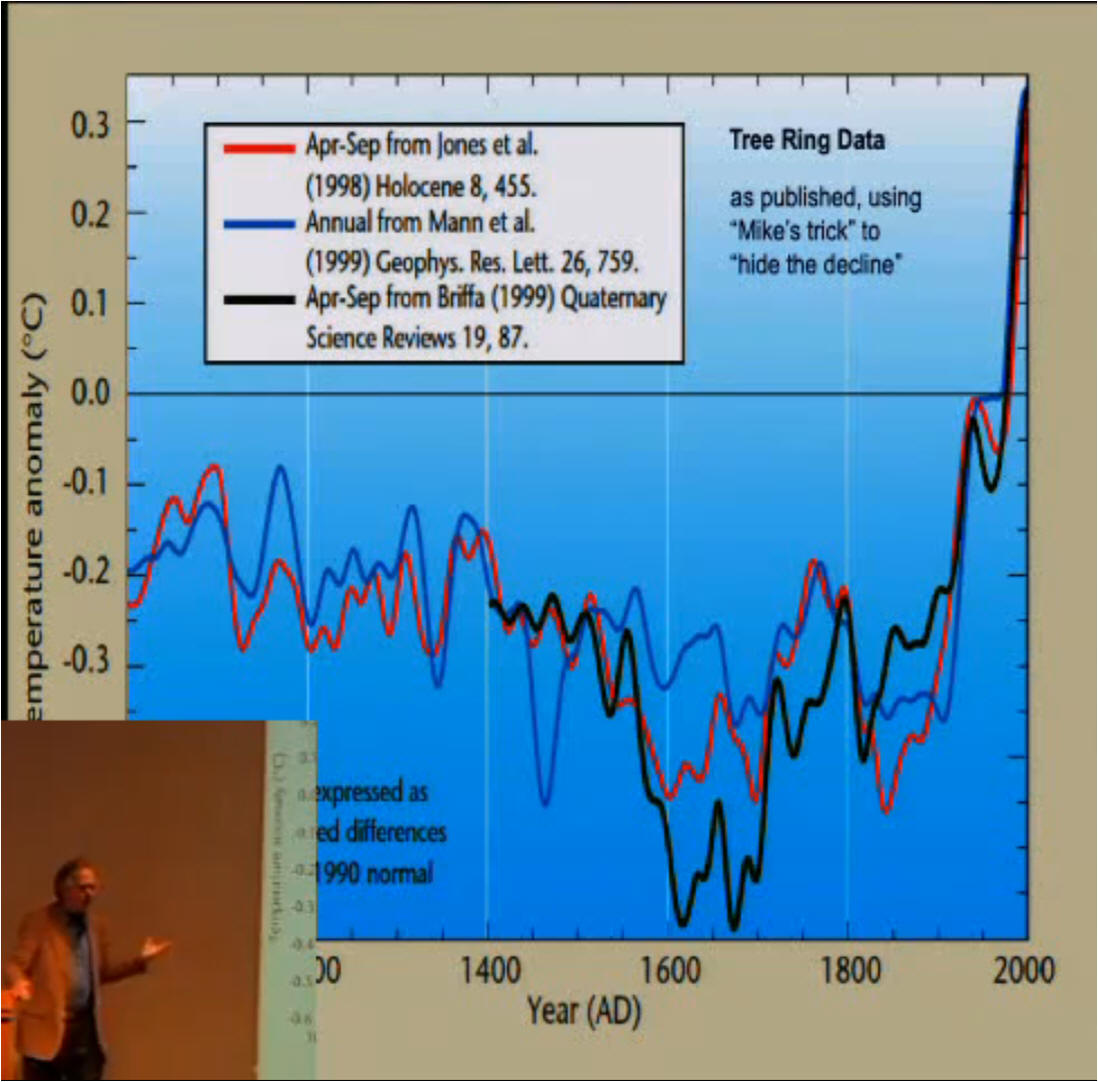
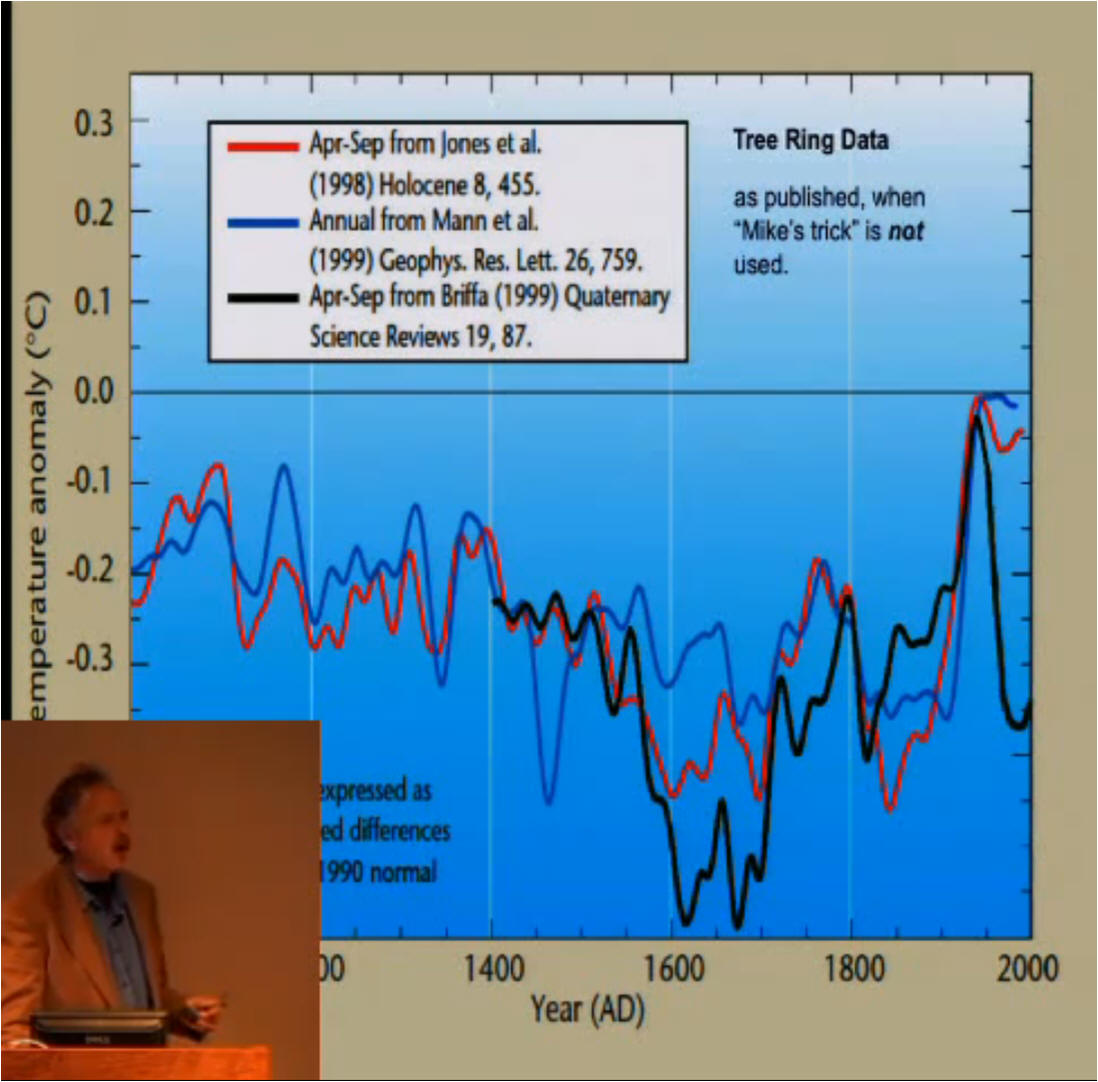
Appendix 4: Berkeley Professor Richard A. Muller - on 'Climategate':
blatant data manipulation
Climategate at the University of East Anglia: Data was
fraudulently manipulated to fit the CO2 based predictions. Using the Freedom of
Information Act, scientists obtained the raw data before manipulation, and
copies of emails which exposed the fraud.
The Fake record, using "Mike's trick to hide the decline".
The True record:
  |
|
Appendix 5: Re-writing History: The Mann Hockey
Stick graph.
 In 1998 recent graduate Michael Mann published this graph of the alleged
temperature record 1000 to 2000. It conveniently showed a stable state for
900 years (even a slight fall) then a massive rise from 1900 to 2000,
coincident with the period of industrialisation. This notorious 'hockey stick'
graph was instantly adopted by the IPCC and became its icon. It was
the centrepiece of the IPCC Climate Change 2001 Report. It ignored the
records from hundreds of reliable scientific sources.
In the next Report, the hockey stick had mysteriously disappeared... In 1998 recent graduate Michael Mann published this graph of the alleged
temperature record 1000 to 2000. It conveniently showed a stable state for
900 years (even a slight fall) then a massive rise from 1900 to 2000,
coincident with the period of industrialisation. This notorious 'hockey stick'
graph was instantly adopted by the IPCC and became its icon. It was
the centrepiece of the IPCC Climate Change 2001 Report. It ignored the
records from hundreds of reliable scientific sources.
In the next Report, the hockey stick had mysteriously disappeared...
Michael Mann's work was investigated and an
exoneration by the National Scientific Agency concluded that there had been no
'fraud', merely some 'errors'. You can form your own opinion.
Unfortunately, the media love simple icons and
attention-catching headlines. The hockey stick has become a permanent icon in
the political collective consciousness. It has become the metaphorical
stick with which we beat our backs to atone for our environmental "sins".
It still appears in publications and online sites such as Wikipedia. It
has become an accepted myth and the symbol of the True Faith.
But the myth is simply not true.
|
|
Appendix 6: 'Trust us, we
know best'
 Rajendra
K. Pachauri, Chairman of the IPCC Rajendra
K. Pachauri, Chairman of the IPCC
From his biography on Wikipedia:
'On 20 April 2002, Pachauri was elected
Chairman of the IPCC.
Pachauri has been vocal on the issue of
climate change and said, "What is happening, and what is likely to
happen, convinces me that the world must be really ambitious and very
determined at moving toward a 350 target." 350
refers to the
level in parts per million of carbon dioxide in the atmosphere that top
climate scientists such as NASA's
James Hansen agree to be a safe upper limit in order to avoid
a climate tipping point.'
The CO2 level has been
over 385 ppmv for some years. Global temperatures have not risen since
2000. The world did not come to an end at 350 ppmv. Why not?
|
 James
Hansen, Director of Goddard Institute, NASA. James
Hansen, Director of Goddard Institute, NASA.
From his biography on Wikipedia:
'In 2008 interviews with ABC News, The
Guardian, and in a separate op-ed, Hansen has called for putting
fossil
fuel company executives, including the CEOs of ExxonMobil
and
Peabody Coal, on trial for "high crimes against humanity and nature", on the
grounds that these and other fossil-fuel companies had actively spread doubt
and misinformation about global warming.'
James Hansen under arrest
outside the White House, 29 August 2011. This is a real photo - not
faked. |
|
On the other hand.... there are a lot of people with vested interests making
exaggerated claims on all sides of the debate. Whom can you trust? It's a tough
question. |
|
Appendix 7: My own prediction: 'Trust me, I
haven't a clue either'
The constant 'adjustments' and 'refinements'
being made with computer based climate modelling systems in order to
get the facts to fit the theory, or vice versa, bring the mind the endless
stream of 'epicycles' of the Ptolemaic Earth-centred solar system model, which
claimed that the sun and the planets orbited the Earth in perfect circles - a
theory which Copernicus and Galileo finally demolished. Because the model was a bad
one, the theory had to be constantly 'refined' by introducing yet another
'epicycle' or two to account for the data as they arose from observations.
Eventually, the weight of epicycles was more than even the most dogmatic
proponents could support, and the theory collapsed.
When a theory is bad or incomplete, it needs endless patching
up. Every additional piece of data has to be somehow 'accommodated'. When
a theory is good, it has a natural beauty. Every additional piece of data simply
adds to its integrity.
It doesn't matter how complex and sophisticated
the theory is, or how powerful are the computers used to run the programs. If it
doesn't have a natural integrity, it eventually collapses.
No-one seriously disputes that CO2 has some greenhouse effect. That is all good physics. The question is, what is
net effect of CO2 on global climate? That is a far more complex
question, with many still unknown factors remaining to be investigated or
discovered.
Here's my prediction: in a decade from now, or less, many of the scientists who
support the "manmade CO2 = catastrophic
warming'' analysis will be making new careers out of
explaining exactly why the analysis was wrong, or incomplete. The
analysis will be
either have been severely moderated as the result of new discoveries, or
in the dustbin of science (apart from the part which is based on sound physics) along with
Lamarckism, 'ether', 'phlogiston',
Lysenko genetics, and the idea that the sun revolves around the Earth. Like many of those incomplete
or erroneous
theories, we should expect to see a long rearguard battle of increasingly
strident propaganda and hysterical witch-hunting of "heretics" by entrenched
political, moral, media, ideological, and commercial interests, and career scientists
and journalists with a reputation to protect.
The latest (rather sad) example is
here.
Poor Dr Wagner 'blames himself' for his inadvertent 'heresy'. Such is the
power of the modern equivalent of the Star Chamber. At least he should be
glad they have done away with the rack and the axe.
|
|
Appendix 8: If the Earth is warming (whether due to
natural causes or other causes), is a warmer Earth so bad?
Charts from www.appinsys.com/GlobalWarming |
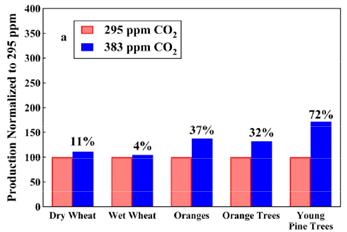 "We will have no food" It can be easily shown that a warmer
Earth and higher levels of CO2 could increase global
food
productivity by 30%. The Medieval Warm Period was a time of
great plenty in Europe. "We will have no food" It can be easily shown that a warmer
Earth and higher levels of CO2 could increase global
food
productivity by 30%. The Medieval Warm Period was a time of
great plenty in Europe.
 |
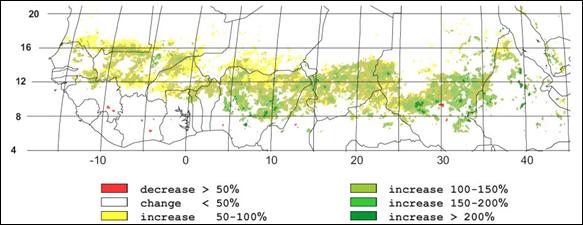 "The
world will become a desert" "The
world will become a desert"After
several decades of declining rainfall and dwindling food production in the
Sahel, reports telling a different story started to appear. Analyses made by
several independent groups of temporal sequences of satellite data over two
decades since early 1980s, showed a remarkable increasing trend in vegetation
greenness.
Warmer air does not necessarily mean less
rain, It can just as well mean more rain. India is both hot and
wet. As is Brazil, Central Africa...
Warmer air has the capacity to hold more
water vapour. Basic physics.
Figure: The results of trend analyses of time series over the Sahel region
of seasonally integrated NDVI using NOAA AVHRR NDVI-data from 1982 to 1999.
Areas with trends of <95% probability in white. (Modified from Olsson, Eklundh
et al. 2005) |
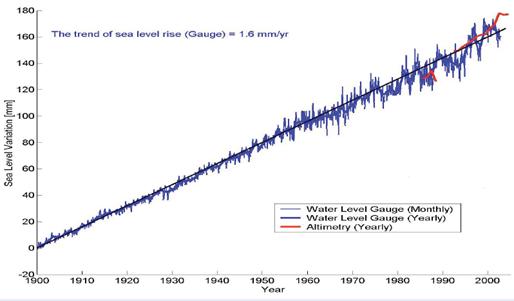 "We are going to drown!" "We are going to drown!"
Sea level rise predictions have been
successively downgraded ever since the IPCC started to make them. Sea defences
can be planned for. Sea level has risen by a total of 160 mm ( 6.5 inches)
at a constant rate since 1900. It is not accelerating as is often claimed
and as would be expected
if it were linked to increasing CO2 levels.
It is not that difficult to plan for another 160mm / 6.5 inch rise over the next 100 years.
Add two bricks to the sea wall.... |
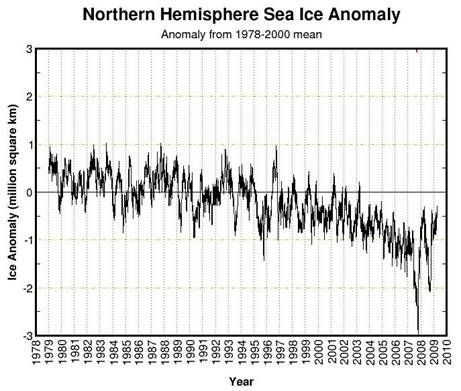 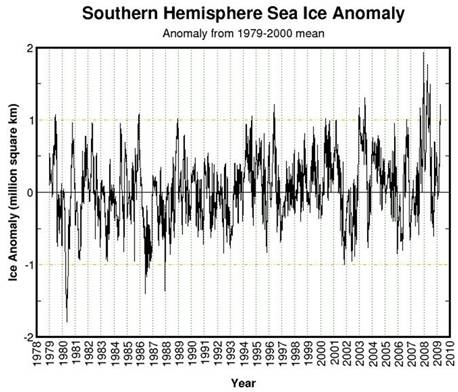 "The
ice is melting" "The
ice is melting"
Northern Hemisphere Sea Ice is decreasing. Left graph.
Southern Hemisphere sea ice is increasing. Right graph |
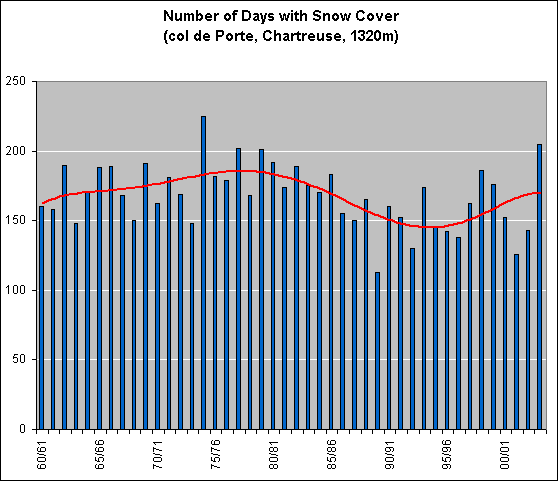
"No more snow!" Snowfall in the Northern Hemisphere has not
decreased in the last 30 years. There are no trends either way.
From pistehors.com: " 98-99 was really exceptional. Huge
snowfalls during February in the Northern Alps, Switzerland and Austria. Avalanches ripped
through the villages of Montroc near
Chamonix and Galtur in Austria. The depth of snow was described as a 500 year
event. "
1998 was the warmest year on
record since 1940.
|
|
"There will be millions of Climate refugees":
The climate
has always changed. 300 years ago Alpine communities were being relentlessly
destroyed by advancing glaciers. The poor Swiss would have liked
some warming then! Why not think how best to support development of
local economies, to avoid the need for any kind
of refugee, whether climatic. economic or political? $60 bn already spent on carbon issues could have paid for a lot of water and electric supply in
Africa and Asia, and better flood precautions for Bangladesh.*
*Most flooding in the
Bangladesh delta is caused by river floods. not sea floods. |
|
From the IPCC Assessment Report 2007:
Some aspects of climate have not been observed to change. {3.2, 3.8, 4.4, 5.3}
·
3.2 Surface Temperature
A decrease in diurnal temperature range (DTR) was reported in the TAR, but the
data available then extended only from 1950 to 1993. Updated observations reveal
that DTR has not changed from 1979 to 2004 as both day- and night-time
temperature have risen at about the same rate. The trends are highly variable
from one region to another. {3.2}
·
·
3.8 Changes in extreme events
There
is insufficient evidence to determine whether trends exist in the meridional
overturning circulation (MOC) of the global ocean or in small-scale phenomena
such as tornadoes, hail, lightning and dust-storms. {3.8, 5.3}
·
·
4.4 Changes in Sea Ice
Antarctic sea ice extent continues to show interannual variability and localised
changes but no statistically significant average trends, consistent with the
lack of warming reflected in atmospheric temperatures averaged across the
region. {3.2, 4.4}
·
5.3 Regional ocean circulation and water masses
Among the major
challenges in understanding the climate system are quantifying the Earth’s heat
balance and the freshwater balance (hydrological cycle), which both have a
substantial contribution from the World Ocean. (No
change)
So perhaps the future is not so bad? |
|
What about real-life decisions?
Like so much in life, it's
a calculated gamble. Looking again at the solar cycle graph, we are near a peak in
recent history. The odds are against ever-increasing solar activity. My
bet would be with David Archibald - the solar activity graph cycle will start to
dip. That means cooling, perhaps by 1 deg C. In which case, increasing the
greenhouse effect by 1 deg C would be just what we need. My instinct would
be: moderate CO2 reasonably, accept the current models with due caution and plan
for a further warming of about 1 deg C. It makes sense, and conserves fossil fuels. Let the Earth and
biosphere deal with the rest. How to moderate CO2 'just
in case'? If we
want to maintain energy supplies, the
only realistic way is to build more nuclear power plants.
Regrettably, wind and tide power will not do the trick. See
David MacKay's work.
Of course whatever we decide in Europe will have little
significance in relation to the rest of the world. If we closed the whole
UK economy down, even using IPCC models it would have a totally trivial effect on
global climate. Whatever we do to moderate CO2 emissions in Europe may
make us feel better, but it will have little effect. By all means
put a solar panel on your roof, and earn money by supplying spare power to the
National Grid; that makes economic sense. Don't spend
money to put a wind turbine on your house; give the money to causes that work on
other environmental issues:
habitat loss, extinction of
species of flora and fauna, loss of biodiversity, rainforest destruction,
pollution, unchecked population growth, adequate food production, clean water,
affordable energy ....
|
|
Appendix 9: Questions to put
to a climate scientist
|
|
1 Has the broadly accepted but theoretically derived
CO2 radiative forcing figure of 1.66 W / sm per 100ppm,been verified experimentally in the field?
|
|
2 Is the IPCC data in fact correct? See Spencer et al:
http://www.mdpi.com/2072-4292/3/8/1603/ **
|
|
3 Is the interpretation of CO2 data correct? Does increase in
CO2 in fact follow natural climate change? Listen to Prof.
Murry Salby:
http://www.thesydneyinstitute.com.au/podcast/global-emission-of-carbon-dioxide-the-contribution-from-natural-sources/
**
|
|
4
Do IPCC models account for the possibility of natural self-regulating climate
feedback such as increased cloud cover?
|
|
5 Do IPCC models account for increased cloud cover as
result of solar activity? |
|
6 Do IPCC calculations account for variations in
the natural emission of heat
from the earth core (at 7000 deg C) and variations due to volcanic activity ,
both surface and underwater? |
|
7 Do IPCC models fully account for the rapid
non-linear
decline in radiative forcing effect with increasing concentration?
 The effect of CO2 concentration in the air is not
linear. It is approximately logarithmic. This is a logarithmic curve: The effect of CO2 concentration in the air is not
linear. It is approximately logarithmic. This is a logarithmic curve: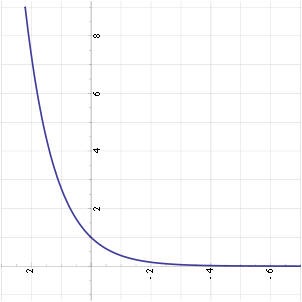
If 100ppmv increase causes 1 deg C increase, a further 100 ppmv
increase will not cause a further 1 degC increase.
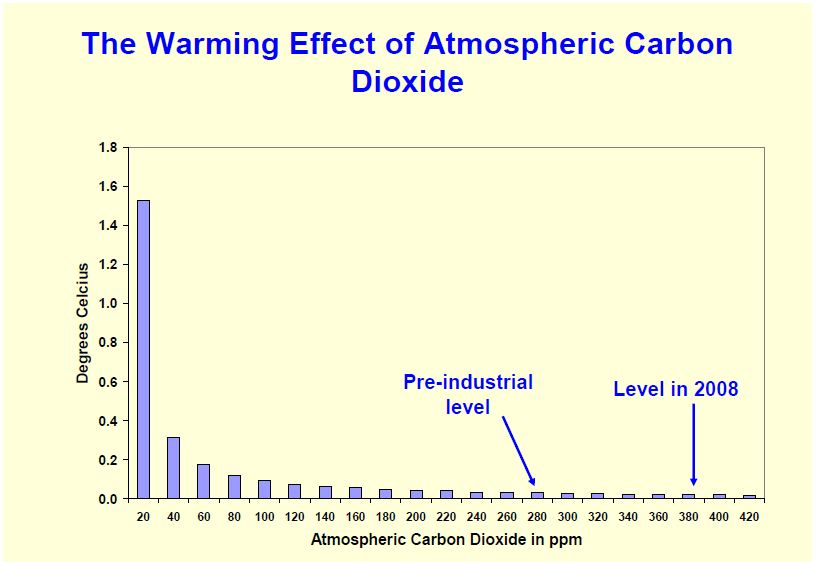
As David Bellamy claims, the first 20ppmv
have the most dramatic effect. Beyond that, the effects diminish rapidly.
The first 20ppmv creates a greenhouse effect of 1.5 degC. But
a 20ppmv increase from 400 to 420 ppmv creates an effect of only 0.01 degC:
each successive 20ppm increase has a diminishing effect.
Graph from David Archibald: Solar Cycle 24, 2008 |
|
Appendix 10: The Cost of Carbon Concern
The UK
Climate Change Act 2008, DECC Impact Assessment, Summary: Analysis and Evidence.
This Act was signed off by Ed Miliband, approved in Parliament by 464 votes to
3, and duly signed by Her Majesty in 2009. It commits spending of
1% of GDP each year, £600
per year for every UK employee, for the next 43 years on 'tackling climate
change'.
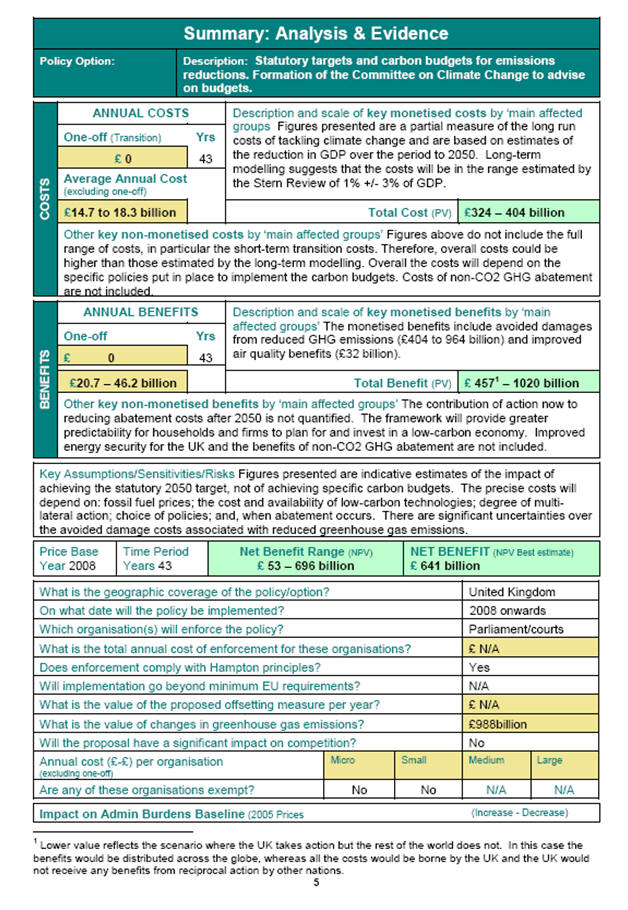
<- £14-18 bn per year. 1% of
total GDP. Total Cost: £324 - 404 billion. [ I make the Total £632 - £789 bn by
the way, has someone screwed up? ] As with most large project estimates, the
actual cost is likely to be much higher.
<- Figures do not include short term transition costs...
<- The 'Benefits' include 'avoided damages' from reduced greenhouse gas
emissions, £404 - 964 bn. But read the small print in the footnote: the £964 bn is only 'if
others join in'. It could be £404 bn. So a possible net benefit of nil if
you accept the £404 bn total cost?
Still. a break-even sounds not too bad, except for one question:
What are the 'avoided damages'?
This is the only mention in the entire study:
"The science indicates that the costs of failing to
limit temperature rises to below 2°C are very significant, and the costs of
inaction leading to temperature rises beyond 4ºC are catastrophically high and
that there would be large net benefits to global action"
That is it. 'The science indicates
catastrophe'.
On that speculative basis of global warming scenarios, the UK government
has committed 1% of its GDP for 43 years.
And if the scenarios are wrong?
Oops, £404 (or £786) billion down the drain. Sorry chaps. Great news for the 'carbon trading' and 'carbon capture' industries though.
BP is already getting in on the act, smart movers.
But as stated with great pride in the Paper, at least
the UK will have set a 'good leadership' example to
the world. While throwing away billions that could have been used
for the benefit of the world, and crippling the economy.
|
|
|
|
Further reading
Since writing this first draft of this paper, I have been referred to this book: The Chilling Stars: A New Theory of Climate Change;
Henrik Svensmark and Nigel Calder. UK 2007. It explains the
theory that solar activity causes climate change, and I have included
material from it in the paper.
The Dissenters:
This 2007 film comes to the same conclusions as I
have, independently. I strongly recommend it. Note that it was made before
the CERN experiment, which has now given even more weight to the argument.
Youtube: The Great Global Warming Swindle
http://www.youtube.com/watch?v=YaTJJCPYhlk
Youtube: Jasper Kirkby on the CLOUD experiment:
http://www.youtube.com/watch?v=63AbaX1dE7I I have added the sun
pictures and the solar wind diagram from that video.
Youtube: Cloud Mystery
http://www.youtube.com/watch?v=Z4XYxL66O_s&feature=related
Youtube: Al Gore sued by 30,000 scientists:
http://www.youtube.com/watch?v=FfHW7KR33IQ
Global Warming Science
- www.appinsys.com/GlobalWarming
One of the best sites to see 'hard facts' and clearly presented graphs. An
encyclopaedia of information.
Prof. Nir Shaviv:
Presentation December 2010
Talk after the CLOUD experiment August 2011
Prof. Nir Shaviv's Blog:
http://www.sciencebits.com/blog/1 Climate realists: http://climaterealists.com/index.php David Evans:
http://opinion.financialpost.com/2011/04/07/climate-models-go-cold/ David Archibald:
http://www.davidarchibald.info
Dr Roy Spencer, Cloud specialist:
http://www.drroyspencer.com/
Ian Plimer : Heaven and Earth : Global Warming: The Missing Science, Quartet
Books 2009 The Official Party Line:
IPCC publications:
http://www.ipcc.ch/publications_and_data/publications_and_data_reports.shtml
Skeptical Science: a fairly balanced overview
of the IPCC case
www.skepticalscience.com
Real Climate:
http://www.realclimate.org NB this
site was set up by Michael Mann, exercise due caution!
Other good reads;
David MacKay:
Sustainable Energy - Without the Hot
Air , Dec 2008 |
|
|
|
Acknowledgments
For years, like most other people, I dutifully accepted
the 'catastrophic manmade global warming' theory as advocated by the IPCC
and accepted by many of our world governments and policy makers. I
listened to (the well intentioned?) Al Gore, I shared in the collective guilt,
and worried about my 'carbon footprint'.
I have spent 11
years un-selfconsciously observing weather in a beautiful part of
the world, in the South of France. From my house 12 km inland, at
400m elevation, I look southwards over Cap d'Antibes and the
Mediterranean coastline, and northward to the nearby hills and the
distant Alps. Every day the sky and the views are different. Some
days the air is clear, the skies are blue, it is hot. Sometimes,
haze is heavy in the air, one can hardly see the coast, it is humid
but the sun heat is less intense, and it is four or five degrees
cooler. Some days, I wake up to an overcast sky, the low lying
clouds are dense, and it has become ten degrees cooler. Clouds and
haze seemed to have much more influence on the weather than carbon
dioxide.
My thanks are therefore due to my long standing friend E M Hoskins, who
first brought my attention to the subject more than a year ago with his own
researches. Although I did not agree with his findings at the time, it
provoked me to respond critically and scientifically. We exchanged many
emails and data. In the process, I learnt a lot. I have now come
around to his views on the relative insignificance of CO2
emissions, albeit for
somewhat different reasons than his original reasons. But it's all part of
the same elephant in the room. So thank you Ed.
Finally, I should note that I am not in the pay of
any oil company, political lobby, or any other organisation. My views are my
own. If you have to give me a label, call me a "concerned liberal thinker
with a reasonably good scientific education".
___________________________________________________________________________________________________
Check the cloud cover...
|